Education
Drawdown: How Far Can Your Bankroll Fall?
Can a €5,000 bankroll fall to €4,500 even if your strategy is profitable?
Yes.
Can it fall to €4,000?
That is also possible.
What about €3,500?
For some strategies, this may still be compatible with normal variance.
This is precisely why one indicator is essential when analyzing a sports betting strategy:
Drawdown measures the decline from a peak in your bankroll to the subsequent low point.
It helps answer a fundamental question:
How far can my bankroll fall before recovering?
Understanding Drawdown is essential for sizing your bankroll correctly, choosing your Stake, comparing strategies and avoiding abandoning a potentially profitable method simply because it is going through a difficult period.
As throughout this series, we will use our reference example:
Starting Bankroll: €5,000
1U = €50
which represents:
1% of the starting bankroll
We will examine how to calculate Drawdown, how to interpret Maximum Drawdown, why some strategies experience much larger declines than others and, most importantly, how to determine whether your bankroll is sufficiently robust to withstand them.
What Is Drawdown in Sports Betting?
Drawdown measures the decline between a high point in your bankroll and the low point reached afterwards.
Let's take a simple example.
Your bankroll starts at:
€5,000
After several profitable weeks, it reaches:
€5,800
A difficult period then causes it to fall to:
€5,200
Drawdown is not calculated from the initial bankroll.
It is calculated from the most recent peak.
Therefore:
€5,800 - €5,200 = €600
The Drawdown is:
€600
With:
1U = €50
this represents:
12U
As a percentage of the €5,800 peak, the decline is approximately:
10.34%
Yet the strategy is still €200 above the initial bankroll.
This is an essential point:
a strategy can remain profitable overall while experiencing a significant Drawdown.
Drawdown Does Not Simply Measure Losses
It is important to distinguish between:
a loss
and:
a Drawdown.
Suppose your bankroll evolves as follows:
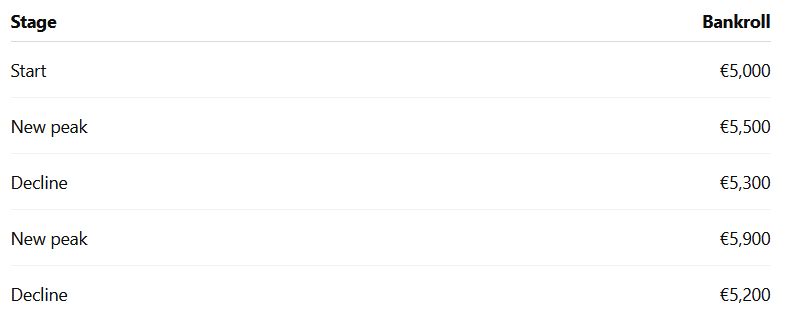
The final decline is not measured from the initial €5,000.
It is measured from the peak of:
€5,900
down to:
€5,200
That is:
€700
The Drawdown is therefore:
€700
or:
14U
Even though the bankroll remains above the initial €5,000.
What Is Maximum Drawdown?
Maximum Drawdown, often abbreviated as Max Drawdown or MDD, represents the largest decline observed from a peak to a subsequent trough over a Track Record.
Consider the following progression:
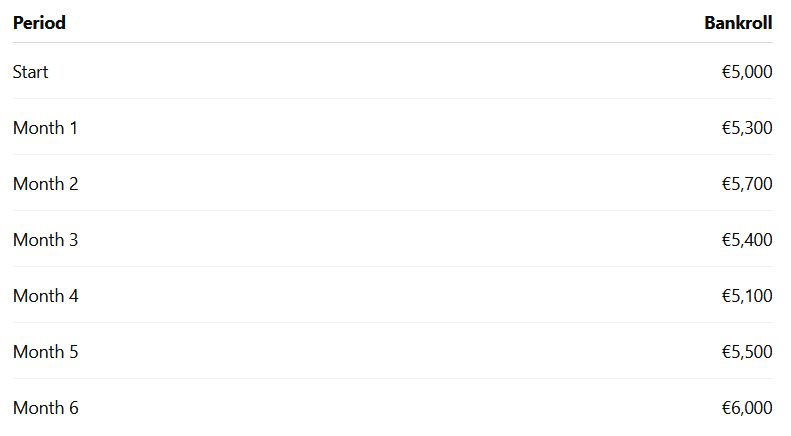
The peak before the decline is:
€5,700
The subsequent low point is:
€5,100
The Maximum Drawdown observed over this period is therefore:
€600
With 1U = €50:
12U
As a percentage of the peak:
600 / 5,700 × 100 ≈ 10.53%
Maximum Drawdown is one of the most important indicators for understanding the historical risk of a strategy.
Why Is Maximum Drawdown Important?
Two strategies can generate exactly the same final profit while having completely different risk profiles.
Imagine two strategies that both finish at:
+30U
Strategy A
Profit:
+30U
Maximum Drawdown:
-8U
Strategy B
Profit:
+30U
Maximum Drawdown:
-28U
The final result is identical.
But the experience for the bettor is very different.
Strategy B required the user to withstand a much larger decline before achieving the same final result.
This is why looking only at profit or ROI is not enough.
You also need to understand:
the path taken to generate that return.
A Profitable Strategy Can Experience a Significant Drawdown
Consider a strategy that eventually generates:
+40U
over 1,500 bets.
Its progression could look like this:
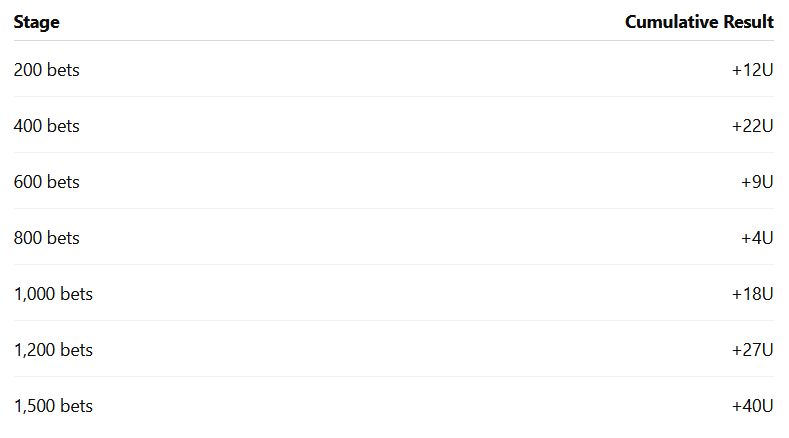
Between the peak of:
+22U
and the subsequent low point of:
+4U
the strategy experiences a Drawdown of:
18U
Yet it eventually finishes at:
+40U
A user who started following the strategy when it was at +22U would have experienced a particularly difficult period.
But that Drawdown does not necessarily prevent the strategy from being profitable over the long term.
Drawdown Depends on Your Entry Point
Two users following exactly the same Tipster can have completely different perceptions of its performance.
User A
Starts when the Tipster is at:
0U
The Tipster reaches +22U and then falls to +4U.
The user is therefore still personally at:
+4U
User B
Starts following the Tipster precisely when it reaches:
+22U
The user then experiences the decline to +4U.
For this user, the result is:
-18U
Same strategy.
Same period.
But a completely different psychological experience.
This is why Drawdown can be particularly difficult for new subscribers.
Drawdown Is Not Necessarily a Losing Streak
A Drawdown does not necessarily correspond to a long sequence of consecutive losing bets.
Consider this sequence:
+1U
-1U
-1U
+0.8U
-1U
+1U
-1U
-1U
The bankroll can gradually decline without necessarily experiencing six or seven consecutive losses.
Drawdown measures:
the cumulative decline from a peak
rather than:
the number of consecutive losses.
The two concepts are therefore related, but different.
How Do You Calculate Drawdown in Units?
Using units makes the analysis much easier.
Suppose a strategy reaches:
+35U
and then falls to:
+17U
The Drawdown is:
35U - 17U = 18U
With our reference:
1U = €50
this represents:
€900
Calculating Drawdown in units also makes it easier to compare strategies independently of each user's bankroll size.
How Do You Calculate Drawdown as a Percentage?
Drawdown as a percentage can be calculated using:
Drawdown % = (Peak - Trough) / Peak × 100
Example:
Peak:
€5,500
Trough:
€4,950
Difference:
€550
Therefore:
550 / 5,500 × 100 = 10%
The Drawdown is:
10%
This measure is particularly useful for understanding the actual impact of the decline on capital.
Drawdown in Euros, Units or Percentage?
All three measurements can be useful.
In Euros
This shows the concrete financial impact.
In Units
This makes it easier to compare different Tipsters and different bankrolls.
As a Percentage
This measures the decline relative to the available capital.
For serious strategy analysis, it is often useful to consider:
all three simultaneously.
Why Do Some Strategies Have Larger Drawdowns?
Drawdown depends on many factors, including:
- the true Edge;
- average odds;
- hit rate;
- variance;
- number of bets;
- Stake Sizing;
- correlation between bets;
- market type;
- betting frequency.
Two strategies with the same ROI can therefore have very different Maximum Drawdowns.
High-Odds Strategies Can Experience Larger Drawdowns
Consider two strategies.
Strategy A
Average odds:
1.60
Relatively high hit rate.
Strategy B
Average odds:
4.00
Lower hit rate.
Even if both strategies have positive Expected Value, the second can experience much longer Losing Streaks.
Its Drawdowns can therefore be deeper.
This does not automatically mean that the strategy is worse.
It simply means that its risk profile is different.
The Higher the Stake, the Greater the Financial Drawdown
Let's consider a Drawdown of:
15U
with a €5,000 bankroll.
If 1U = 0.5%
Stake:
€25
15U represents:
€375
or:
7.5% of the starting bankroll
If 1U = 1%
Stake:
€50
15U represents:
€750
or:
15%
If 1U = 2%
Stake:
€100
15U represents:
€1,500
or:
30%
If 1U = 5%
Stake:
€250
15U represents:
€3,750
or:
75%
The same statistical Drawdown of 15U can therefore have completely different consequences depending on Stake Sizing.
Table: Impact of Drawdown According to Unit Size
With a starting bankroll of €5,000:
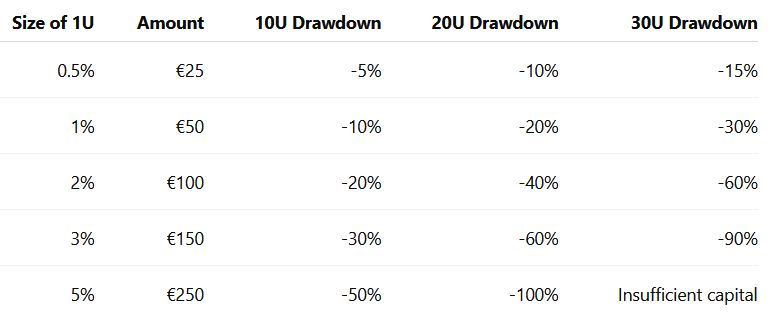
This table illustrates why unit size is so important.
A statistically possible Drawdown can become financially unsustainable if the Stake is too large.
How Far Can Your Bankroll Actually Fall?
There is no universal answer.
One mistake would be to think:
"This strategy has never experienced more than a -15U Drawdown, so it will never exceed -15U."
That is incorrect.
Historical Maximum Drawdown describes:
what has already happened.
It does not define:
the maximum possible loss in the future.
A Track Record with a -15U Maximum Drawdown could one day experience:
-18U
-22U
or more.
Past data provides information about risk.
It does not establish an absolute limit.
Historical Maximum Drawdown Does Not Mean Future Maximum Drawdown
This is a fundamental point.
Suppose a strategy has:
2,000 bets
and a historical Maximum Drawdown of:
18U
It would be dangerous to size your bankroll on the assumption that:
18U is the worst possible scenario.
As the number of bets increases, new sequences of results become possible.
Over 5,000 or 10,000 bets, a Drawdown greater than the previous record may occur.
This is why a margin of safety is necessary.
A Longer Track Record Reveals More Drawdowns
A strategy with only:
100 bets
may have a Maximum Drawdown of:
5U
That may look reassuring.
But the figure is based on very little data.
After:
1,000 bets
its Maximum Drawdown could be:
12U
After:
5,000 bets
it could reach:
20U
This does not necessarily mean that the strategy has deteriorated.
A longer Track Record has simply provided more opportunities for unfavorable sequences to occur.
Maximum Drawdown Must Always Be Analyzed With Sample Size
Maximum Drawdown therefore has limited meaning without knowing the number of bets over which it was observed.
Compare:
Strategy A
Maximum Drawdown:
8U
Sample Size:
80 bets
Strategy B
Maximum Drawdown:
12U
Sample Size:
3,000 bets
It would be too simplistic to conclude that Strategy A necessarily carries less risk.
Its Track Record is simply much shorter.
Sample Size is essential when interpreting Drawdown correctly.
Drawdown Can Last a Long Time
The depth of a Drawdown is not the only important factor.
You should also consider:
its duration.
A strategy may lose:
15U in two weeks
and then recover quickly.
Another may remain:
8U below its previous peak for six months.
Psychologically, the second situation can sometimes be more difficult to tolerate.
Risk therefore has at least two dimensions:
Drawdown depth
and:
Drawdown duration.
What Is Time Under Water?
Time Under Water measures the length of time a strategy remains below its previous peak.
Suppose the bankroll reaches a peak on:
January 1
Then it declines.
It does not exceed its previous peak again until:
April 15
The strategy has remained below its peak for approximately:
three and a half months.
This metric is a very useful complement to Maximum Drawdown.
A strategy can have a relatively moderate Drawdown but remain below its previous peak for a long time.
Deep Drawdown or Long Drawdown: Which Is Harder?
That depends on the user.
A Drawdown of:
-20U over three weeks
can be financially difficult.
A Drawdown of:
-10U over eight months
can be psychologically difficult.
In the first case, the pressure comes mainly from the depth of the loss.
In the second, it comes from the prolonged absence of progress.
A complete risk analysis should therefore consider both.
Why Users Often Quit at the Worst Possible Time
Human behavior plays an important role.
A strategy performs strongly.
It attracts new users.
Then it enters a Drawdown.
Some users begin to doubt it.
After several weeks of losses, they stop following it.
If the strategy subsequently returns toward its historical trajectory, those users may effectively have:
started after a positive period
and:
stopped after a negative period.
In other words, they may have followed precisely the most unfavorable part of the curve.
Understanding Drawdown helps reduce this type of emotional decision-making.
Does a New Maximum Drawdown Mean the Strategy No Longer Works?
Not automatically.
A new record Drawdown deserves analysis.
But by itself, it does not prove that the Edge has disappeared.
You should examine:
- Sample Size;
- odds obtained;
- CLV;
- recent ROI;
- Flat Stakes Summary (1U);
- market changes;
- liquidity;
- selection process;
- model evolution.
A new Maximum Drawdown may be:
an extreme but normal manifestation of variance
or:
a sign of genuine deterioration in the strategy.
More information is needed to distinguish between the two.
The Role of CLV During a Drawdown
CLV can provide very important additional information.
Suppose a Tipster experiences:
an -18U Drawdown
but continues to consistently obtain odds above the market's Closing Odds.
This may suggest that the process is still identifying attractive prices despite negative recent results.
Conversely, a Drawdown accompanied by a significant deterioration in CLV may justify deeper analysis.
Financial results should therefore not be viewed in isolation.
Flat Stakes Summary (1U) Helps Explain Drawdown
When Stakes vary, actual Drawdown can be amplified by Stake Sizing.
Suppose:
Actual Maximum Drawdown: 25U
but:
Flat Stakes Summary (1U) Maximum Drawdown: 14U
This indicates that a significant part of the decline may have resulted from Stake allocation.
Conversely:
Actual Maximum Drawdown: 18U
Flat Stakes Summary (1U) Maximum Drawdown: 17U
suggests that the Drawdown primarily came from the selections themselves.
This comparison helps identify the source of risk more clearly.
Drawdown and ROI Should Be Analyzed Together
A high ROI can be attractive.
But it should be compared with the risk required to achieve it.
Consider two hypothetical strategies:
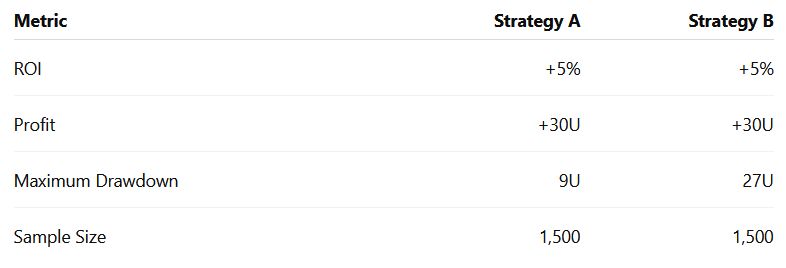
Both strategies generated the same return.
But their trajectories were very different.
This information alone is not enough to determine which strategy is better.
However, Drawdown provides essential information about their risk profiles.
Drawdown and Risk-Adjusted Return
A more advanced analysis involves comparing the return generated with the Drawdown experienced.
For example:
Strategy A
Profit:
+40U
Maximum Drawdown:
10U
Strategy B
Profit:
+40U
Maximum Drawdown:
30U
Historically, the first strategy generated the same profit with a smaller maximum decline.
This type of comparison can help analyze capital efficiency.
However, Sample Size must always be considered, along with the fact that future Maximum Drawdown can exceed historical Maximum Drawdown.
Why a 100U Bankroll Provides a Useful Margin of Safety
With our reference:
Bankroll = €5,000
1U = €50
we have:
100U
A Drawdown of:
10U
represents:
10%
A Drawdown of:
20U
represents:
20%
A Drawdown of:
30U
represents:
30%
These declines are still significant.
But the bankroll retains a substantial portion of its capital.
By contrast, with a unit representing 5% of the bankroll, a 20U Drawdown would theoretically correspond to the entire starting capital.
Stake size therefore directly determines your ability to survive variance.
How Many Units Should Your Bankroll Contain?
There is no universal answer.
It depends on:
- variance profile;
- average odds;
- hit rate;
- historical Maximum Drawdown;
- Sample Size;
- number of simultaneous bets;
- correlation;
- accepted level of risk.
A bankroll of:
100U
provides a simple educational benchmark when:
1U = 1%
But some strategies may require greater caution.
This is particularly true when average odds are high or results are highly volatile.
Should You Reduce Your Stake During a Drawdown?
Changing your Stake simply because recent results have been poor can be problematic.
Ideally, a Stake rule should be defined before the negative period begins.
If you use a proportional Stake based on your current bankroll, the monetary amount may naturally decrease as your bankroll falls.
For example:
Bankroll:
€5,000
1%:
€50
If the bankroll falls to:
€4,000
1% becomes:
€40
In this case, the Stake automatically decreases with your capital.
This is not an emotional reaction.
It is the application of a predefined rule.
Fixed Flat Stake or Proportional Stake During Drawdown?
With a fixed monetary Flat Stake:
1U = always €50
If the bankroll falls from €5,000 to €4,000, €50 now represents:
1.25%
of the remaining capital.
With a proportional Stake of 1%:
Bankroll €5,000:
€50
Bankroll €4,000:
€40
Risk automatically decreases with the bankroll.
Both approaches can be used, but they do not behave in exactly the same way during a Drawdown.
Why Drawdown Is Also a Psychological Test
A strategy can be mathematically suitable for your bankroll but psychologically too difficult for you to follow.
Imagine knowing that a Drawdown of:
20U
is statistically plausible.
With 1U = €50, that means accepting a temporary decline of:
€1,000
on a starting bankroll of €5,000.
Some people may be comfortable with that.
Others may start changing their strategy after only:
-5U
The right Stake is therefore not only the one your bankroll can withstand.
It must also be compatible with your ability to remain disciplined.
The Worst Drawdown Is Often the One You Have Not Yet Observed
This idea is essential.
Historical Maximum Drawdown is not a boundary.
It is simply:
the worst Drawdown observed so far.
As the Track Record grows, a new record may occur.
Prudent bankroll management should therefore maintain a margin of safety beyond historical data.
Sizing your bankroll exactly around the worst event observed in the past assumes that the future will never be more difficult than the past.
That is a dangerous assumption.
How Should You Analyze a Drawdown Properly?
When a strategy enters a Drawdown, several questions should be asked:
- How deep is the Drawdown in units?
- What percentage of the bankroll does it represent?
- How many bets make up the Drawdown?
- How long has the strategy remained below its peak?
- What was its previous Maximum Drawdown?
- What is the total Sample Size?
- Have average odds changed?
- Is CLV still positive?
- Does the Flat Stakes Summary (1U) show a similar decline?
- Have liquidity or market conditions changed?
This approach prevents conclusions from being based solely on financial results.
What Drawdown Does Not Tell You
Drawdown is a very useful indicator.
But it cannot, by itself, determine whether a strategy is good or bad.
It does not directly tell you:
- whether the Edge is real;
- whether ROI is sustainable;
- whether the odds obtained are good;
- whether CLV is positive;
- whether Sample Size is sufficient;
- whether market conditions have changed.
Drawdown must therefore be integrated into a broader analysis.
Metrics to Analyze Alongside Drawdown
To evaluate a strategy seriously, it is useful to combine:
ROI
Profit in units
Maximum Drawdown
Sample Size
CLV
Average odds
Hit rate
Liquidity
Flat Stakes Summary (1U)
Track Record duration
Together, these metrics provide a much more complete picture of both return and risk.
Conclusion
Drawdown is one of the most important metrics for understanding the real risk of a sports betting strategy.
It measures the decline between:
a peak
and:
the subsequent trough.
A strategy can be profitable over the long term while still experiencing significant Drawdowns.
That is normal.
The real problem occurs when the Stake is too large for the bankroll to absorb these negative periods.
With our example:
Starting Bankroll: €5,000
1U = €50
1U = 1%
a Drawdown of:
10U = €500 = 10% of the starting bankroll
20U = €1,000 = 20%
30U = €1,500 = 30%
These figures clearly show why Stake Sizing is directly linked to Drawdown.
But another essential principle must be remembered:
historical Maximum Drawdown is never a guarantee for the future.
A strategy whose worst historical Drawdown is 15U may one day experience 20U or more.
This is why a bankroll should always include a margin of safety.
Finally, Drawdown should never be analyzed in isolation.
It should be considered alongside:
Sample Size
ROI
CLV
odds
liquidity
Flat Stakes Summary (1U)
and:
Track Record duration.
The right question is therefore not simply:
"How much has my bankroll lost?"
But rather:
"Is this decline compatible with the normal risk profile of my strategy, and is my bankroll sufficiently sized to withstand it?"
Understanding this distinction allows you to move beyond simply observing profits and toward genuine risk management.
FAQ: Drawdown and Bankroll in Sports Betting
What Is Drawdown in Sports Betting?
Drawdown measures the decline from a bankroll peak to the subsequent low point. For example, a decline from €5,500 to €4,950 represents a €550 Drawdown, or 10%.
What Is Maximum Drawdown?
Maximum Drawdown is the largest decline from a peak to a subsequent trough observed over the entire Track Record of a strategy.
Does a Drawdown Mean a Strategy Is No Longer Profitable?
No. A profitable strategy can experience multiple Drawdowns. The depth of the decline should be analyzed alongside Sample Size, ROI, CLV and other metrics.
What Is an Acceptable Drawdown?
There is no universal level. It depends on the strategy, odds, hit rate, variance, Stake Sizing and the amount of risk the bettor is prepared to accept.
Can Future Maximum Drawdown Exceed Historical Maximum Drawdown?
Yes. Historical Maximum Drawdown only shows the worst decline observed so far. It does not establish a limit for future Drawdowns.
Why Does 1U = 1% Help Manage Drawdowns?
With 1U = 1%, a bankroll theoretically contains 100U. A 20U Drawdown therefore represents 20% of the starting bankroll, whereas with 1U = 5%, the same Drawdown would theoretically represent 100% of the starting capital.
What Is the Difference Between Drawdown and a Losing Streak?
A Losing Streak refers to several consecutive losing bets. Drawdown measures the cumulative decline from a peak. A Drawdown can therefore occur without a long sequence of consecutive losses.
What Is Time Under Water?
Time Under Water measures how long a strategy remains below its previous peak before establishing a new high.
Should You Stop a Strategy When It Reaches a New Maximum Drawdown?
Not automatically. A new Maximum Drawdown should trigger a deeper analysis of ROI, CLV, Sample Size, odds, Flat Stakes Summary (1U) and any potential market changes.
Which Metrics Should Be Analyzed Alongside Drawdown?
It is useful to analyze ROI, profit in units, Sample Size, CLV, average odds, hit rate, liquidity, Track Record duration and Flat Stakes Summary (1U) alongside Drawdown.
Wednesday, 16 September 2026
In my same category
Education
Risk of Ruin: Can You Really Lose Your Entire Bankroll?
Saturday, 19 September 2026
You have a €5,000 bankroll.You bet €50 per wager, or 1% of your initial capital.Your strategy appears to be profitable over the long term.Can you still lose your entire bankroll?This question brings us to one of the most important concepts in sports betti...
See the articleEducation
Bankroll and Variance: Why a Good Bettor Can Lose for Several Weeks
Monday, 14 September 2026
In sports betting, one of the most common mistakes is assuming that a good bettor should win consistently.A few losing days can feel worrying.Two negative weeks can make you question a strategy.A difficult month can even create the impression that an Edge...
See the articleEducation
What Is a Unit (1U) in Sports Betting?
Wednesday, 9 September 2026
In sports betting, you will often see results expressed like this:+12U+35.4U-8Uor:ROI: +5.2% | Profit: +24UBut what does the letter U actually mean?The U simply stands for Unit.A unit is a reference used to express bet size and measure the performance of ...
See the articleBet2Invest is not a bookmaker and does not offer sports betting services. However, its content relates to betting activities.
Gambling is strictly prohibited for minors. Gamble responsibly — excessive gambling can lead to financial loss, debt, or addiction.